
Which analytics a manager really needs
A manager does not need hundreds of charts, but a connected system of metrics that reveals results, deviations, and the specific processes requiring attention.
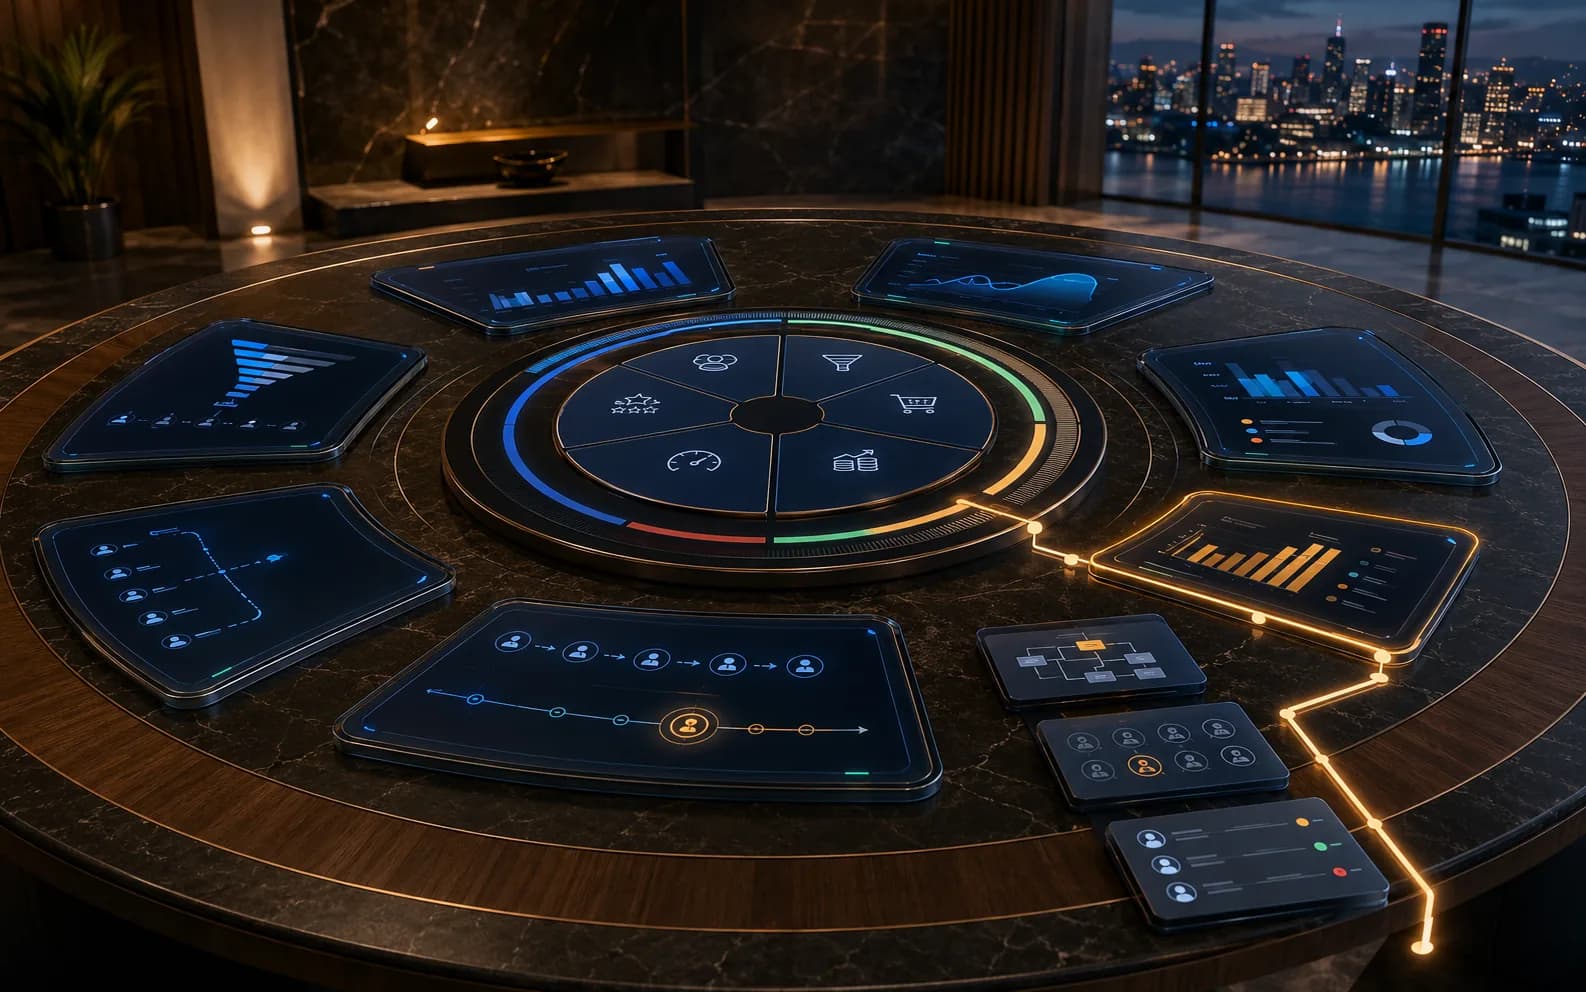
A manager does not need hundreds of charts and endless tables. They need a system of metrics that answers the main questions within minutes: how many clients arrived, how many completed the target action, where the company is losing enquiries, how much has been earned, and which processes require attention right now.
The sales section should show the number of new enquiries, client sources, conversion between stages, average order value, and reasons for rejection. First-response speed, enquiry processing time, overdue tasks, and deals that remain inactive for too long must be monitored separately.
Financial analytics should show payments, outstanding balances, refunds, repeat purchases, and revenue trends. The time taken to resolve enquiries, number of complaints, repeat contacts, and overall client satisfaction are important for evaluating client service.
Employee analytics should not be based solely on the number of calls and messages or the time spent in the system. Results matter far more: processed enquiries, completed tasks, adherence to deadlines, closed deals, and service quality.
Every metric should have a data source, measurement period, responsible person, and target value. If a KPI deviates from the norm, the manager should be able to move from the general chart to the specific deals, clients, employees, or process stages that affected the result.
A metrics and KPI system for a digital platform
I have prepared a detailed PDF guide covering the analytics structure for sales, finance, marketing, client service, employees, and internal processes, together with metric calculation formulas and an example management dashboard.